Observability Platform
Designing a unified observability platform across DigitalOcean
Creating a shared observability framework across AI, GPU, Kubernetes and infrastructure products — from 0→1 in three months.
MY ROLE AND SCOPE
COHESIVE DESIGN STRATEGY FOR MULTIPLE PRODUCTS
MY ROLE
Lead / sole Product Designer
SCOPE
AI Inference, GPU, Kubernetes, and infrastructure monitoring
PARTNERS
PMs, engineering leads, engineers & design partners
LAUNCH
Public preview in 3 months
I owned the end-to-end design direction for observability across all the product areas — from defining the shared experience architecture to designing individual workflows and reusable patterns.
Because each product had its own team & requirements, a significant part of my role was creating alignment around what should be standardized across DigitalOcean and what needed to remain product-specific.
THE CHALLENGE
MULTIPLE PRODUCTS. DIFFERENT OBSERVABILITY NEEDS. ONE PLATFORM
DigitalOcean was serving increasingly complex infrastructure products, including AI Inference, GPU compute and Kubernetes. Each product needed observability, but teams were approaching it independently.
There was no shared definition of what observability across different products of DigitalOcean.
The challenge wasn't simply designing dashboards. It was creating a system flexible enough to support very different technical products while making observability feel like one cohesive DigitalOcean experience.
USER CONTEXT
DIFFERENT USERS, ONE SHARED BLIND SPOT
Lead devs & DevOps leads

12
Managing infrastructure at scale
WHAT ARE USER NEEDS
Format
1:1 Interviews
Currently using metrics, logs etc.
WHO ARE THE USER
WHAT USERS WANT TO ACHIEVE
CTOS
Tracking cost and resource efficiency
Criteria
GPU/K8S Power Users
Running large DOKS clusters, GPU Droplets with advanced telemetry requirements.
Due to fast paced nature of the work and tight timeline, I conducted research with internal users:
No. of users
CREATING THE PLATFORM FRAMEWORK
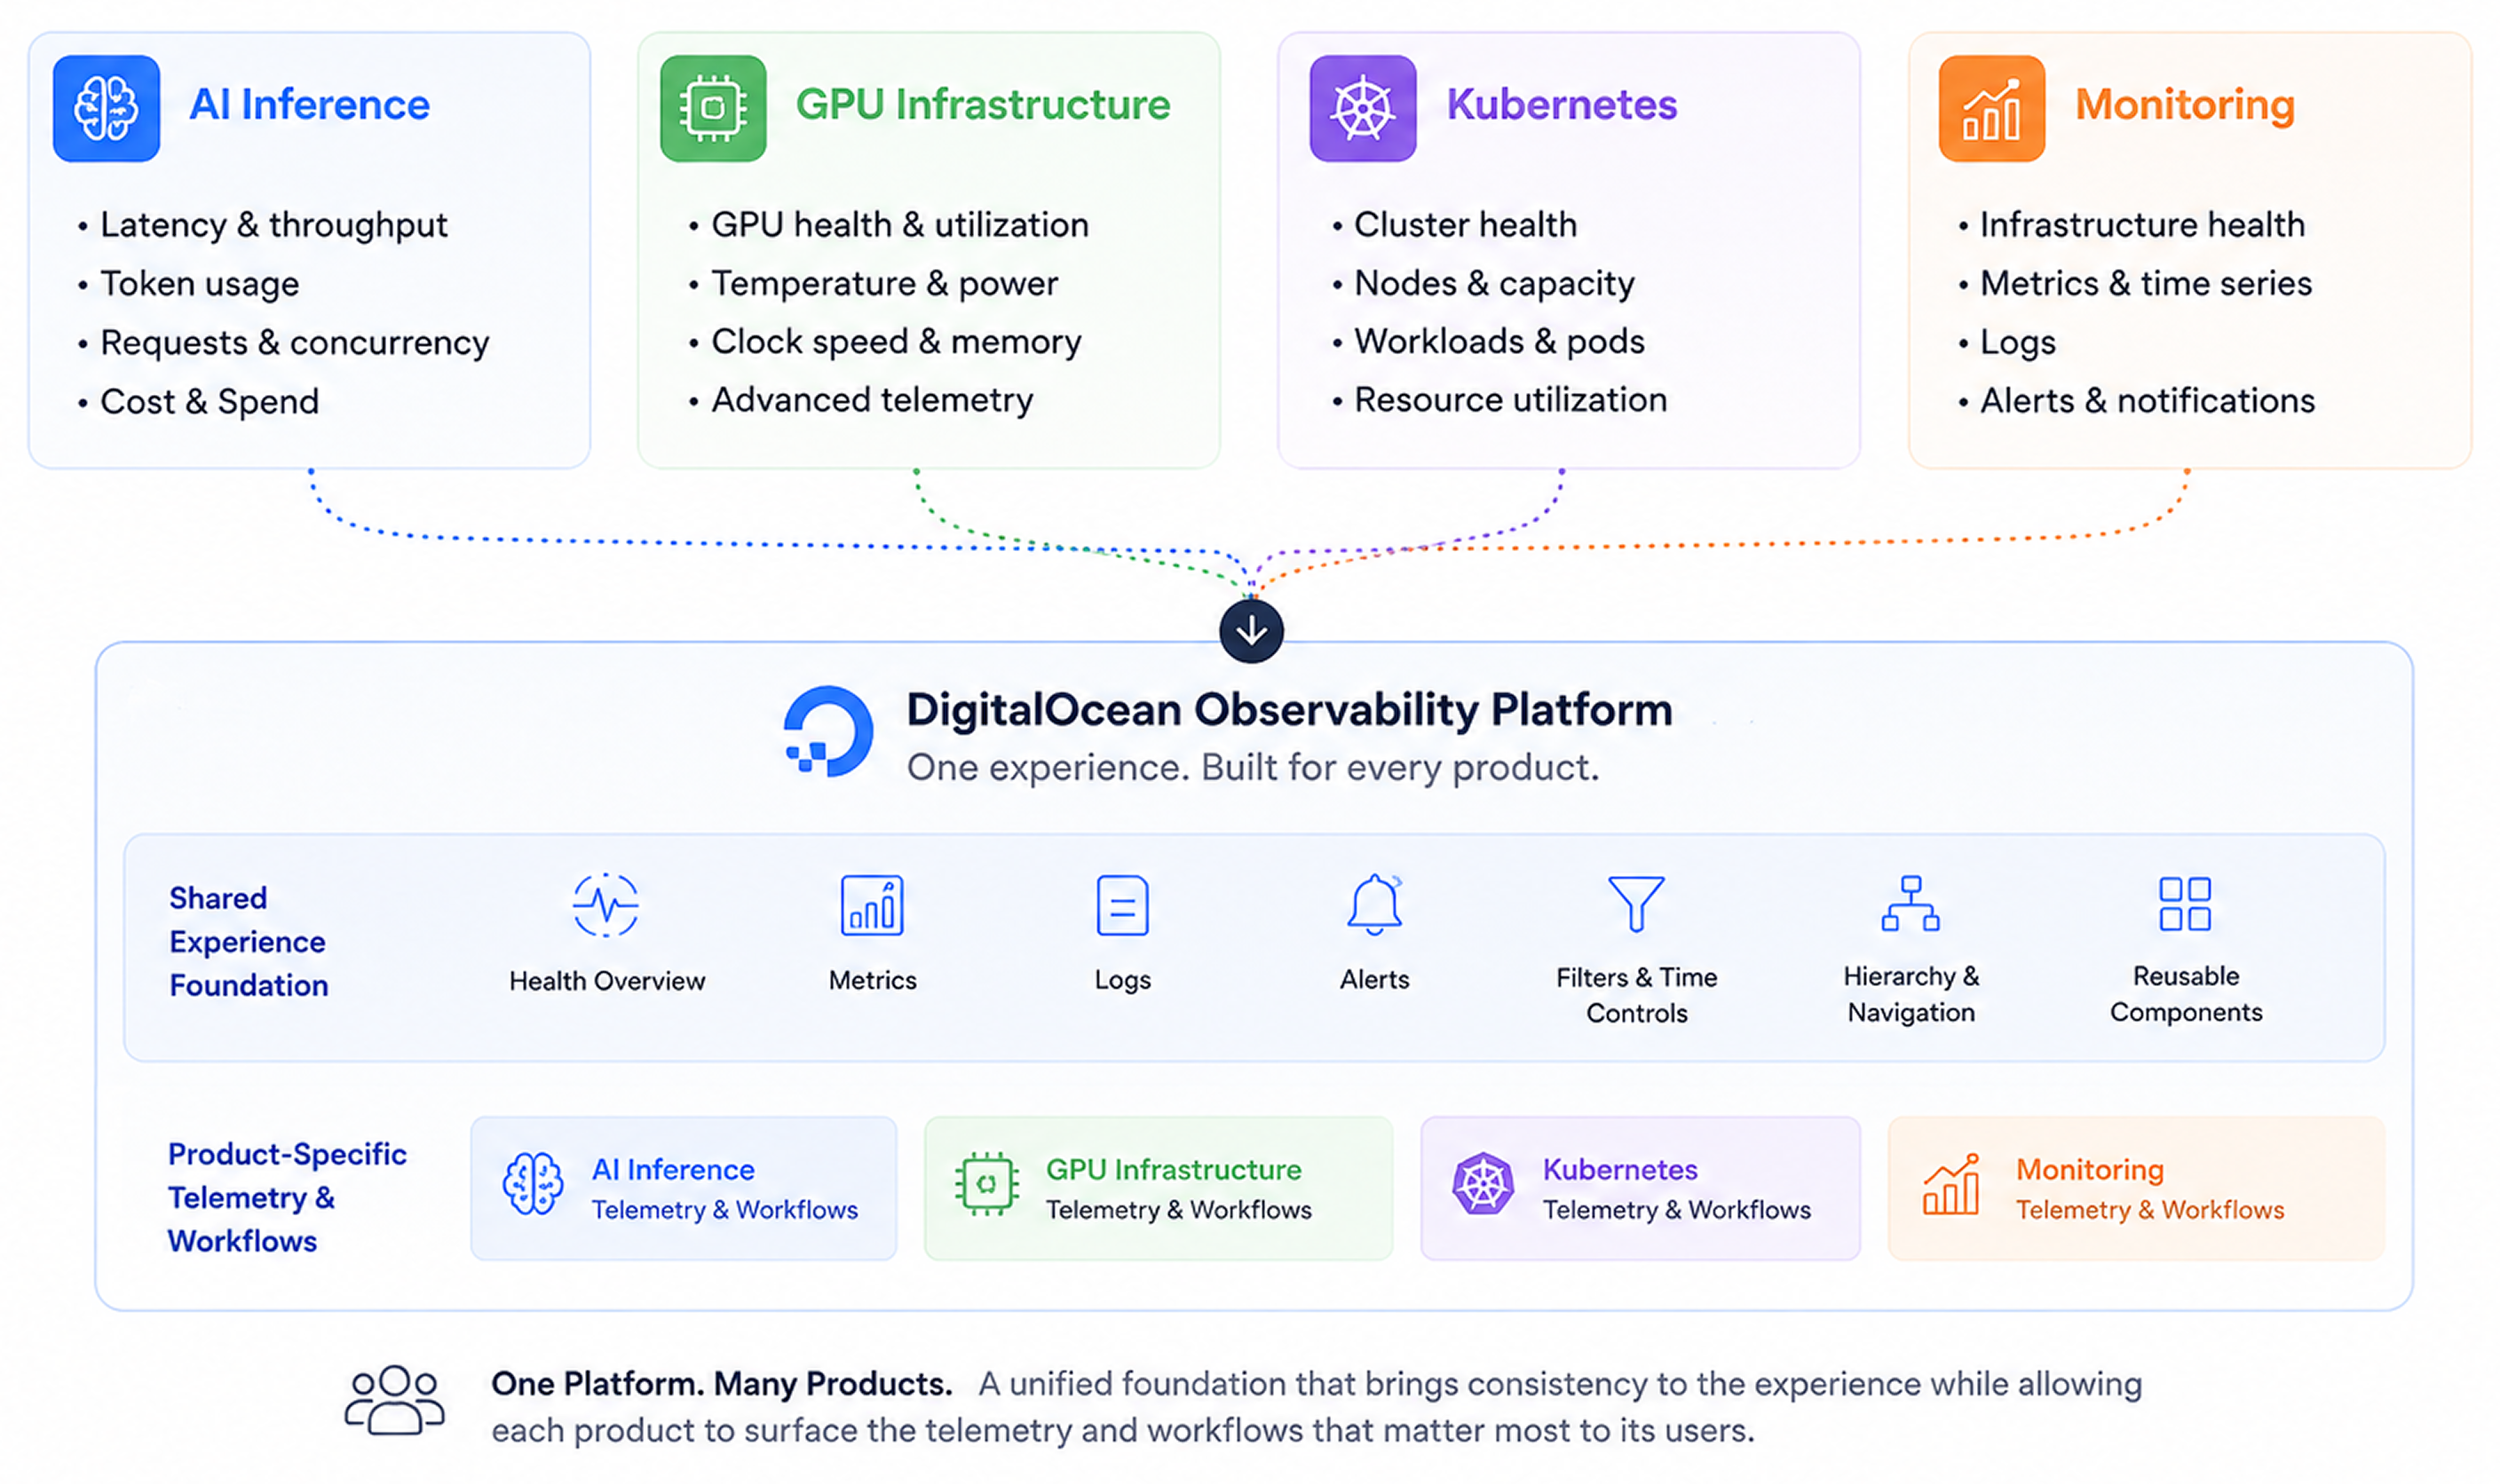
FOUR TEAMS AND FOUR DEFINITIONS OF OBSERVABILITY
There were no shared platform requirements when I started. Each product team understood its domain deeply, but their needs were very different.
THE SYSTEM DECISION
STANDARDIZE THE STRUCTURE, NOT THE TELEMETRY
Instead of forcing every product into the same dashboard, I created a layered observability model that standardized how users move from system health to diagnosis while allowing each product to surface the telemetry relevant to its domain.
The shared model followed a consistent progression: Health Overview → Fleet Metrics → Resource Details
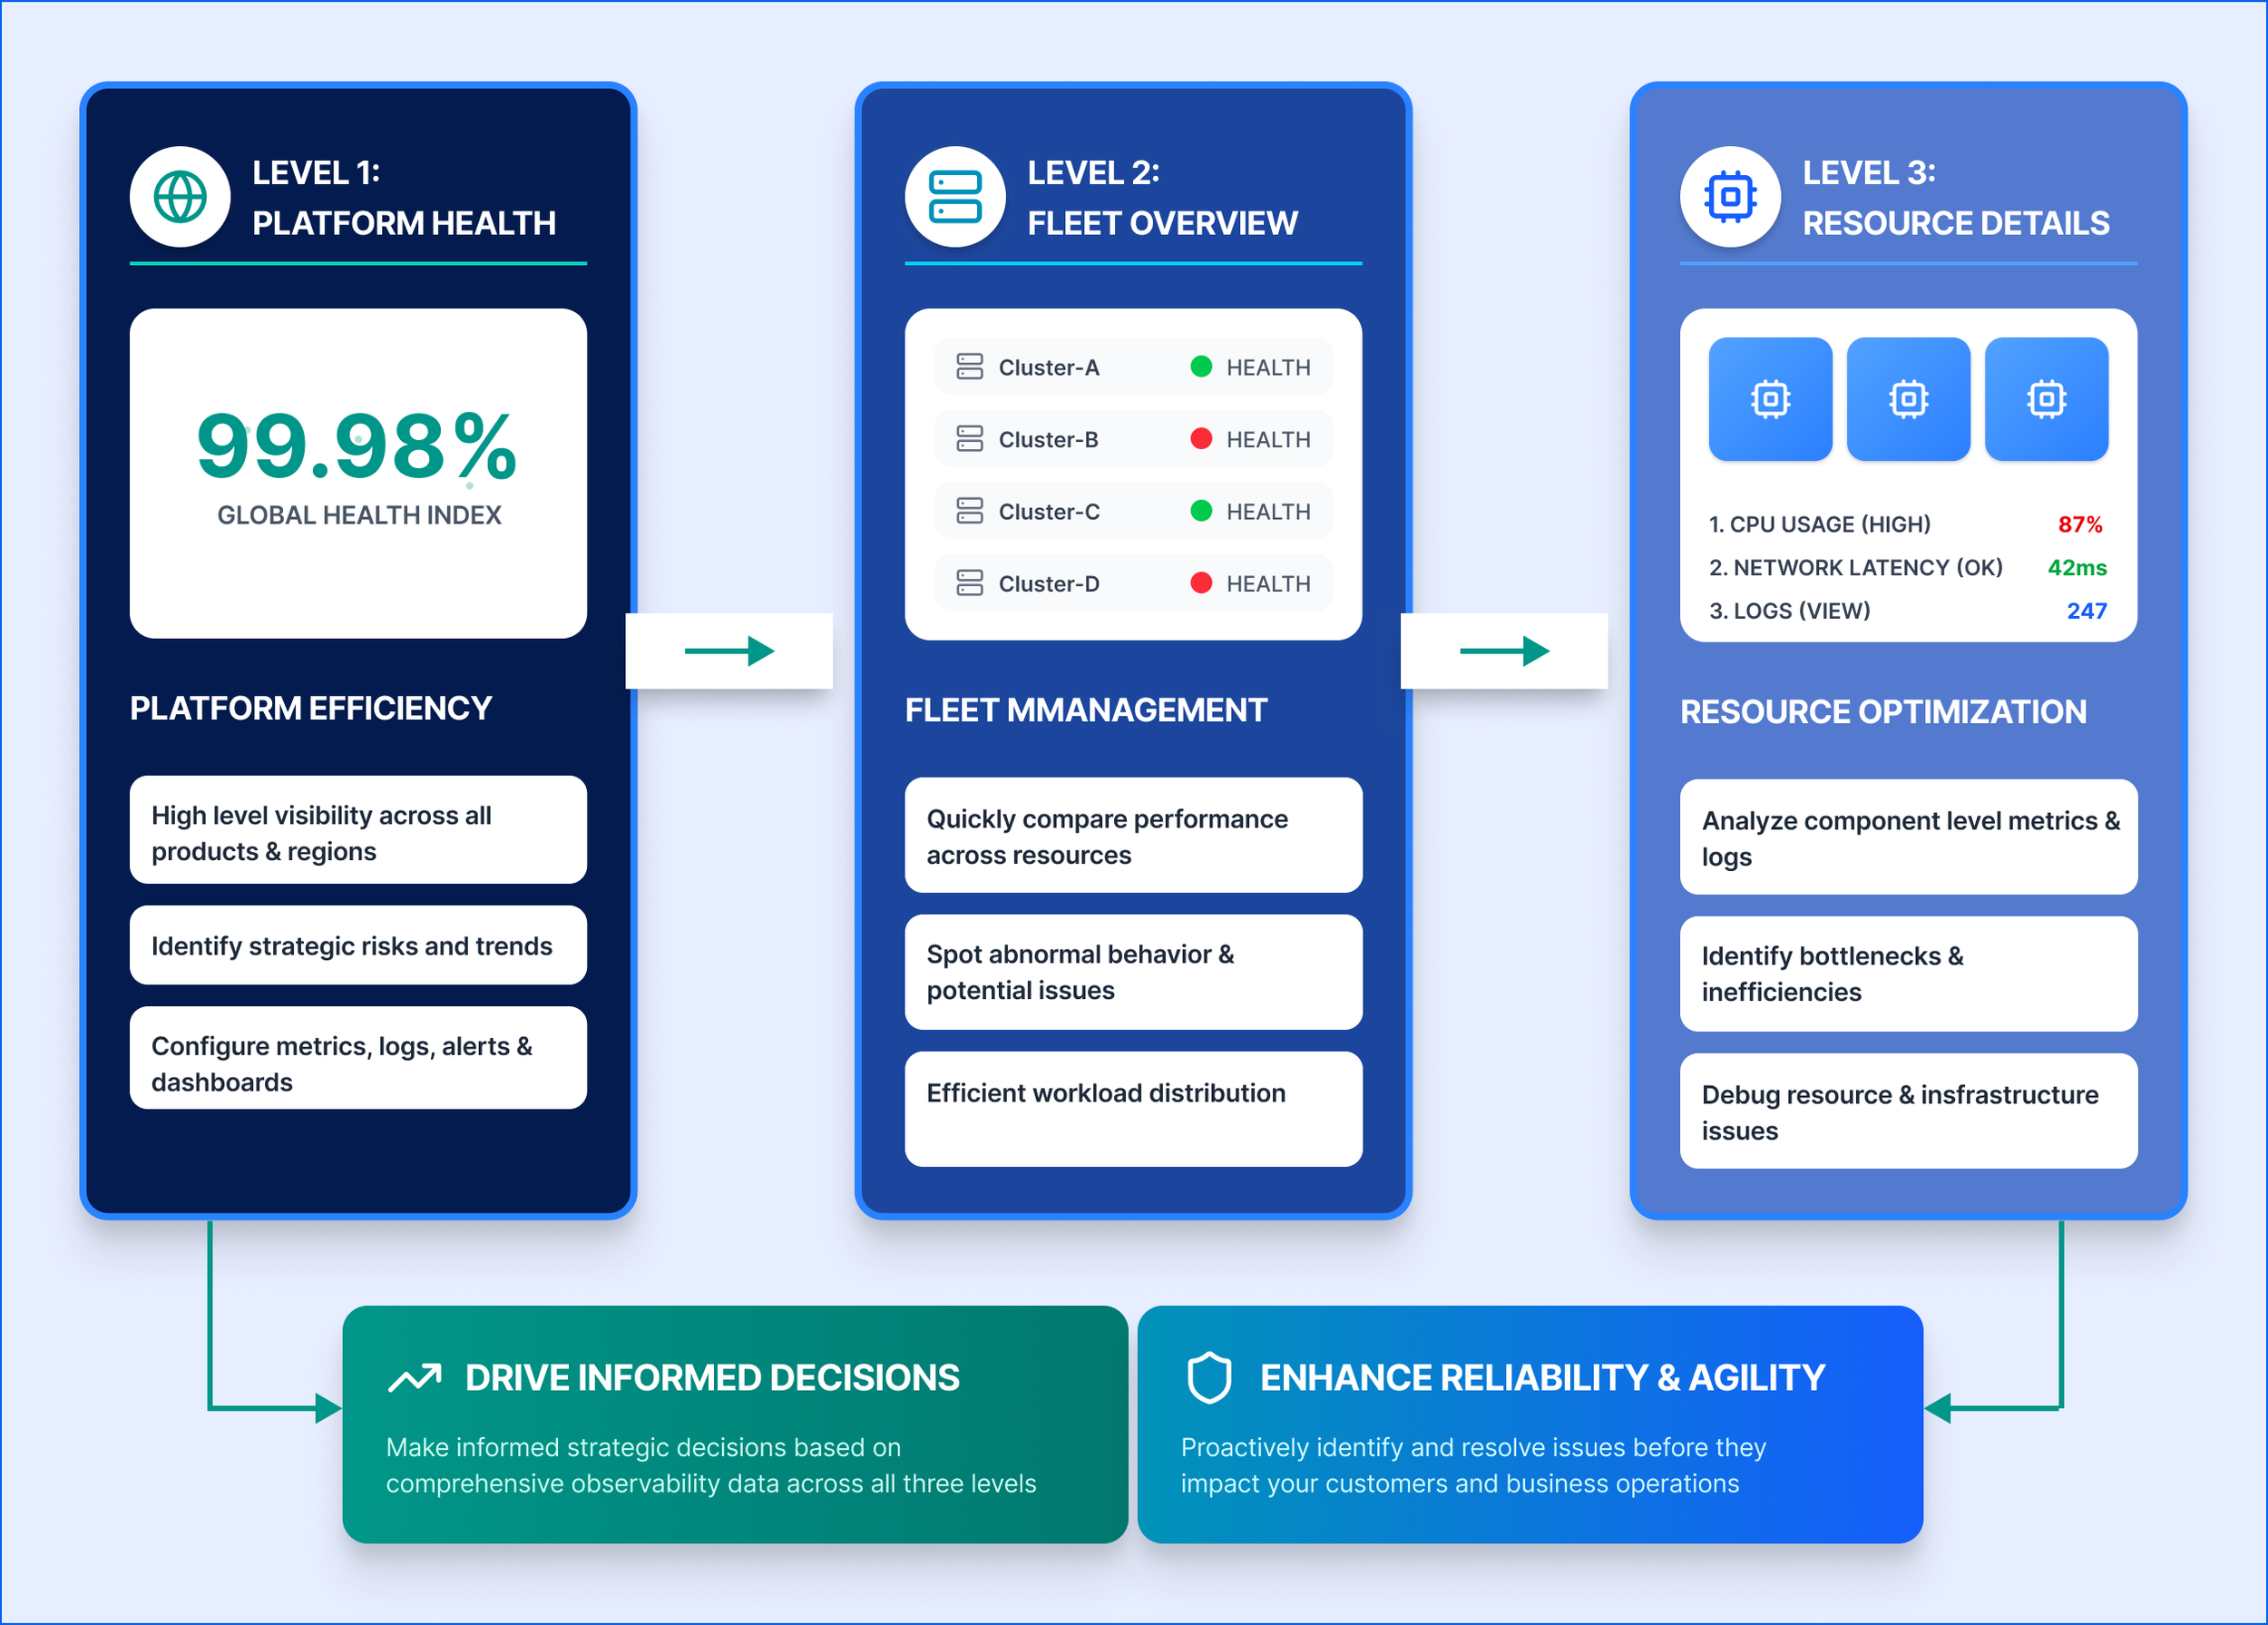
What changed was the domain-specific telemetry and workflows inside that framework. This gave teams enough flexibility to solve specialized product problems without creating entirely different experiences.
THREE DECISIONS TO SHARE PLATFORM
01 : STANDARDIZE HIERARCHY, NOT METRICS
The products shared a common user intent — understand health, investigate a problem & determine what to do next — but the signals users needed were very different.
I used that shared intent as the foundation of the platform rather than trying to standardize the data itself. This created a system that could scale as additional DigitalOcean products adopted observability.
02 : TRANSLATE TELEMETRY INTO DECISIONS
Infrastructure products expose enormous amounts of telemetry. But exposing more data doesn't necessarily make a product more useful.
I shifted the experience from simply displaying telemetry toward interpreting system health.
Where possible, the UI connected: Signal → Health → Context → Recommended action
This became an important principle across the platform: observability should help users make decisions, not simply expose infrastructure data.
03 : KEEP COMMON WORKFLOWS SIMPLE; SUPPORT ADVANCED USERS
User needs surfaced another challenge: different users required dramatically different levels of information.
Rather than exposing all of that complexity by default, I created a layered experience:
Basic observability : Health and essential metrics for common monitoring workflows.
Advanced observability : Deeper telemetry and diagnostic capabilities for users who needed them.
This kept the default experience approachable while giving the platform room to support increasingly sophisticated workflows.
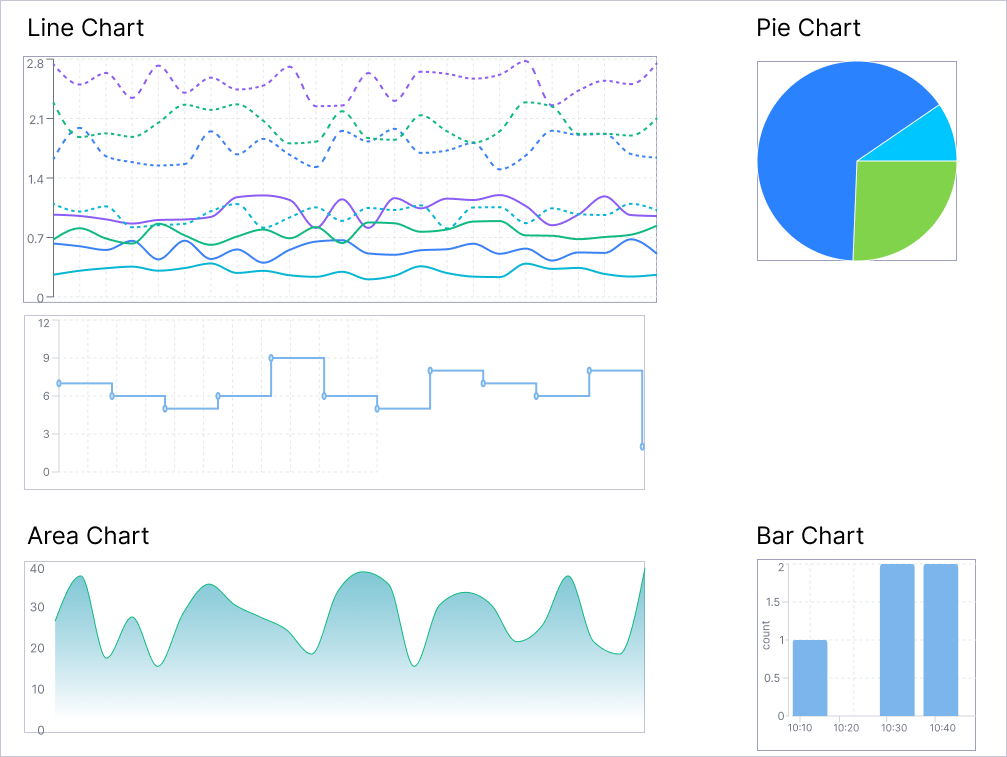
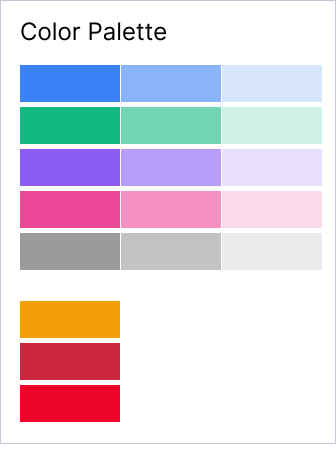
FROM METRICS TO VISUAL LANGUAGE
APPLYING THE FRAMEWORK
AI INFERENCE: CONNECTING PERFORMANCE & USAGE
For AI Inference, the initial product direction treated cost & performance as separate experiences.
I challenged that separation. For AI workloads, cost is in the context of performance. A cheaper model isn't necessarily better if latency increases significantly or output quality suffers.
Instead of creating isolated views, I designed the experience so users could evaluate signals together such as:
Latency · Token usage · Request volume · Cost
This allowed users to reason about tradeoff they actually cared about: What performance am I getting for what I'm spending?
APPLYING THE FRAMEWORK
GPU OBSERVABILITY: FROM RAW METRICS TO SYSTEM HEALTH
Advanced GPU infrastructure exposes dozens of metrics, but the volume & technical nature can make it difficult to understand whether the system is actually healthy.
I structured experience around progressive diagnosis -
1. Is my GPU infrastructure healthy? Users first see fleet-level health and important signals.
2. Where is the problem? They can move from the fleet into a specific resource.
3. What's causing it? Detailed telemetry and logs provide diagnostic context.
4. What should I do? Where possible, the experience connects abnormal signals to actionable guidance.
EXPANDING TO ALL PRODUCTS
HOW THE SYSTEM SCALED
Once the core framework was established, I applied it across additional DigitalOcean products.
Each product retained the telemetry & workflows its users needed while sharing the same underlying experience architecture.
This allowed us to move from designing individual monitoring screens toward building a reusable observability system.
AI Observability - Serverless Inference Insights
GPU Observability - Logs Insights
AI Observability - Dedicated Inference Insights
Observability Dashboard
THE COLLABORATION
FROM FRAGMENTED REQUIREMENTS TO PUBLIC PREVIEW
Due to tight deadline fundamentally, there wasn't enough time to sequentially define requirements, design each product, validate everything and then hand designs to engineering. Design, product definition & technical feasibility happened in parallel.
I worked directly with PM & engineering leads to make decisions quickly, identify what needed to be part of the first release and distinguish platform-level patterns from product-specific requirements.
The goal wasn't to solve every future observability use case before launch. It was to establish a strong enough foundation that we could ship the first experience on time without creating design debt that would prevent the platform from scaling afterward.
AI ACCELERATED DESIGN
USING AI AS A FORCE MULTIPLIER - NOT A SHORTCUT
I used Figma Make, Lovable & Cursor to rapidly explore data-dense layouts and create higher-fidelity interactive prototypes.
Code-based prototypes gave engineering a more concrete artifact for discussing interaction behavior and technical feasibility, allowing design and engineering conversations to happen earlier.
AI accelerated: Visual exploration · Prototyping · Iteration · Engineering communication
Critical decisions still required product & design judgment: Information architecture · Telemetry strategy · Product tradeoffs · System consistency · Cross-team alignment
AI helped increase the speed at which ideas could be explored; it didn't replace the reasoning behind them.
OUTCOME
A COHESIVE PLATFORM THAT HOLDS TOGETHER
Within three months, we moved from fragmented requirements across multiple product teams to a cohesive observability platform launched in Public Preview for the conference.
Qualitative feedback from early users, however, was positive and helped validate the direction of the experience and the need for a more cohesive approach to observability.
0 → 1 LAUNCH
SHIPPED 0→1 PLATFORM ON SCHEDULE
The first observability experience launched in time for the conference despite the scope spanning multiple product areas & engineering teams.
DESIGN OUTCOME
ESTABLISHED REUSABLE DESIGN SYSTEM
Instead of shipping isolated dashboards, we created shared patterns and resource hierarchy that could be reused across products.
CROSS-PRODUCT ALIGNMENT
CREATED ALIGNMENT CROSS PRODUCT TEAMS
The framework gave PM & eng teams a shared model for discussing observability while still supporting specialized needs of their individual products.